Add charts manually
1. Create a new report

Click Dashboard on the left, then click the "+" sign to create a new report, fill in the report name (required) and report description (optional).
2. Fill in the report information

Click Create Chart, then click Data allcation on the page to select the database corresponding to the generated report.

After selecting, write the corresponding sql statement, click Run, and then click Back to Chart.
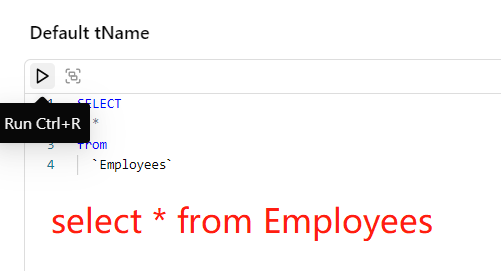
For example: I want to query the information in the Employees table and create a report.
3.Select report type
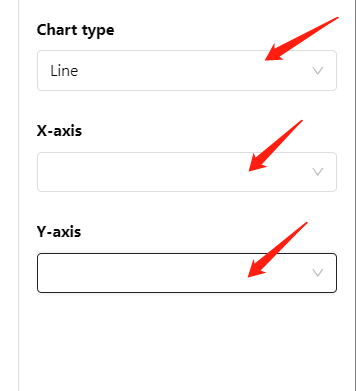
Select the report type here and determine the corresponding variables (horizontal and vertical axis coordinates, percentages...) according to the selected type.
4. Save the report
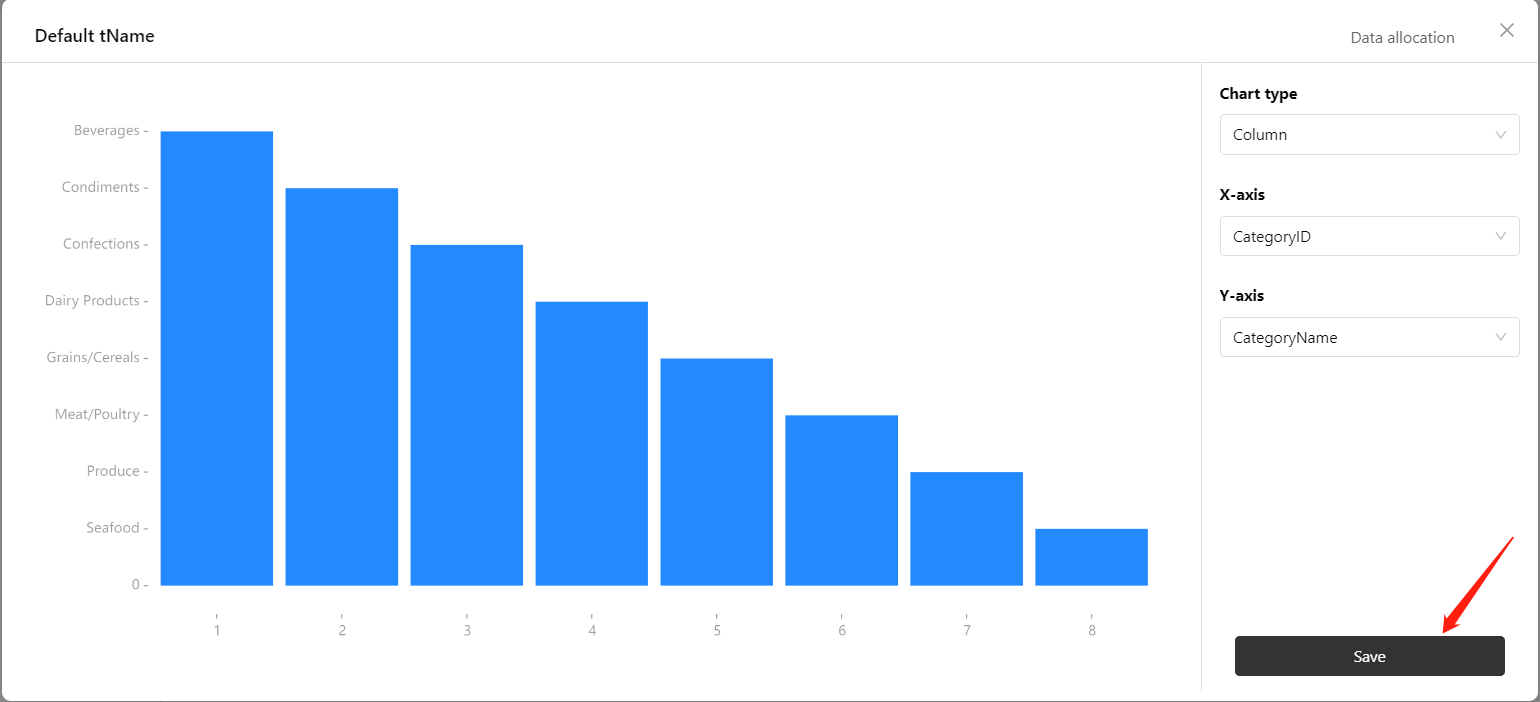
After selecting, click save to save!
